
Introduction
As a Frontend Developer, one of the most important skills that you must master is how to use the Google Developer Console to make your daily work easier. As a big tech company that has a large foundation of developers, Google understands the stress and struggles a developer could have when he/she cannot find the bug in his/her program. Therefore when developing their products, Google has made Chrome not only user friendly, but more importantly, developers oriented. There are many cool features on Google Chrome that not only can help you trace issues on your website faster, but on top of that, improve the performance of your website. In this article, we will go over some of the key features that you’ll need.
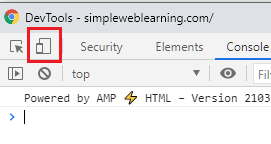
Start the console
To get started, open the Chrome Developer Tool by pressing F12 if you are on Windows or Ctrl + Option + J if you are on Mac. Once the developer tool is opened, you may click on the three little dots on the right to change the Dock mode to your personal preference. Personally I like to have the developer tool opened as a separate window, so I can have more space to work with and it won’t squeeze my browser window, but it’s up to you.
Arrow on top left corner
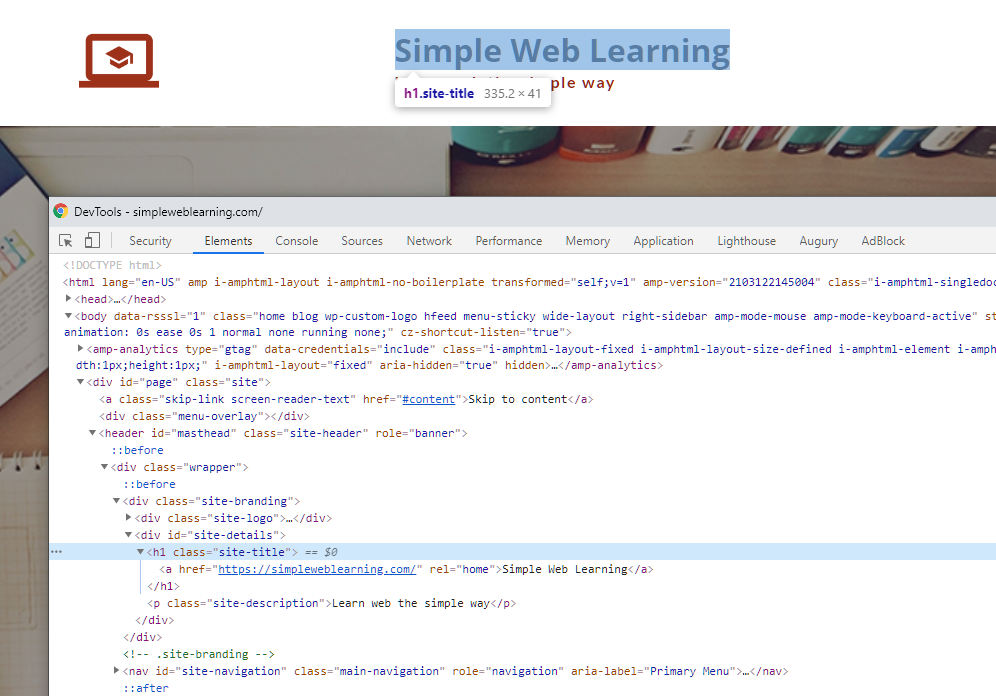
The arrow on the top left corner allows you to quickly allocate the DOM element of any elements you see on the browser. When you click on the arrow and hover on the element you want to investigate on the page, some basic CSS properties will be displayed right away. In addition, if you click on the element that’s being highlighted, Chrome Developer Tool will bring you to the Elements tab and focus on the corresponding HTML code of the element you clicked.
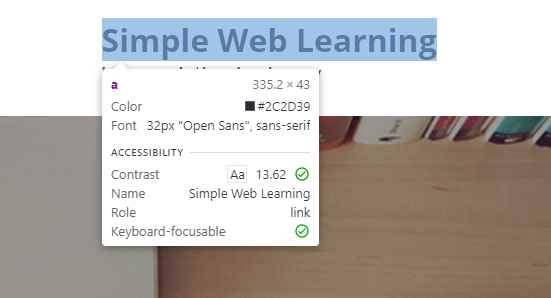
This feature is especially helpful when you are having trouble with the z-index of elements on the page. When you cannot click on an element on a webpage, it’s likely because it has some invisible elements with higher z-index laying on top of it. In this situation, you may use this little arrow to help you identify the real DOM element you click.
Device Toolbar
Next to the arrow you can find an icon of a mobile and tablet device. When you click on the icon, you will enter responsive mode.
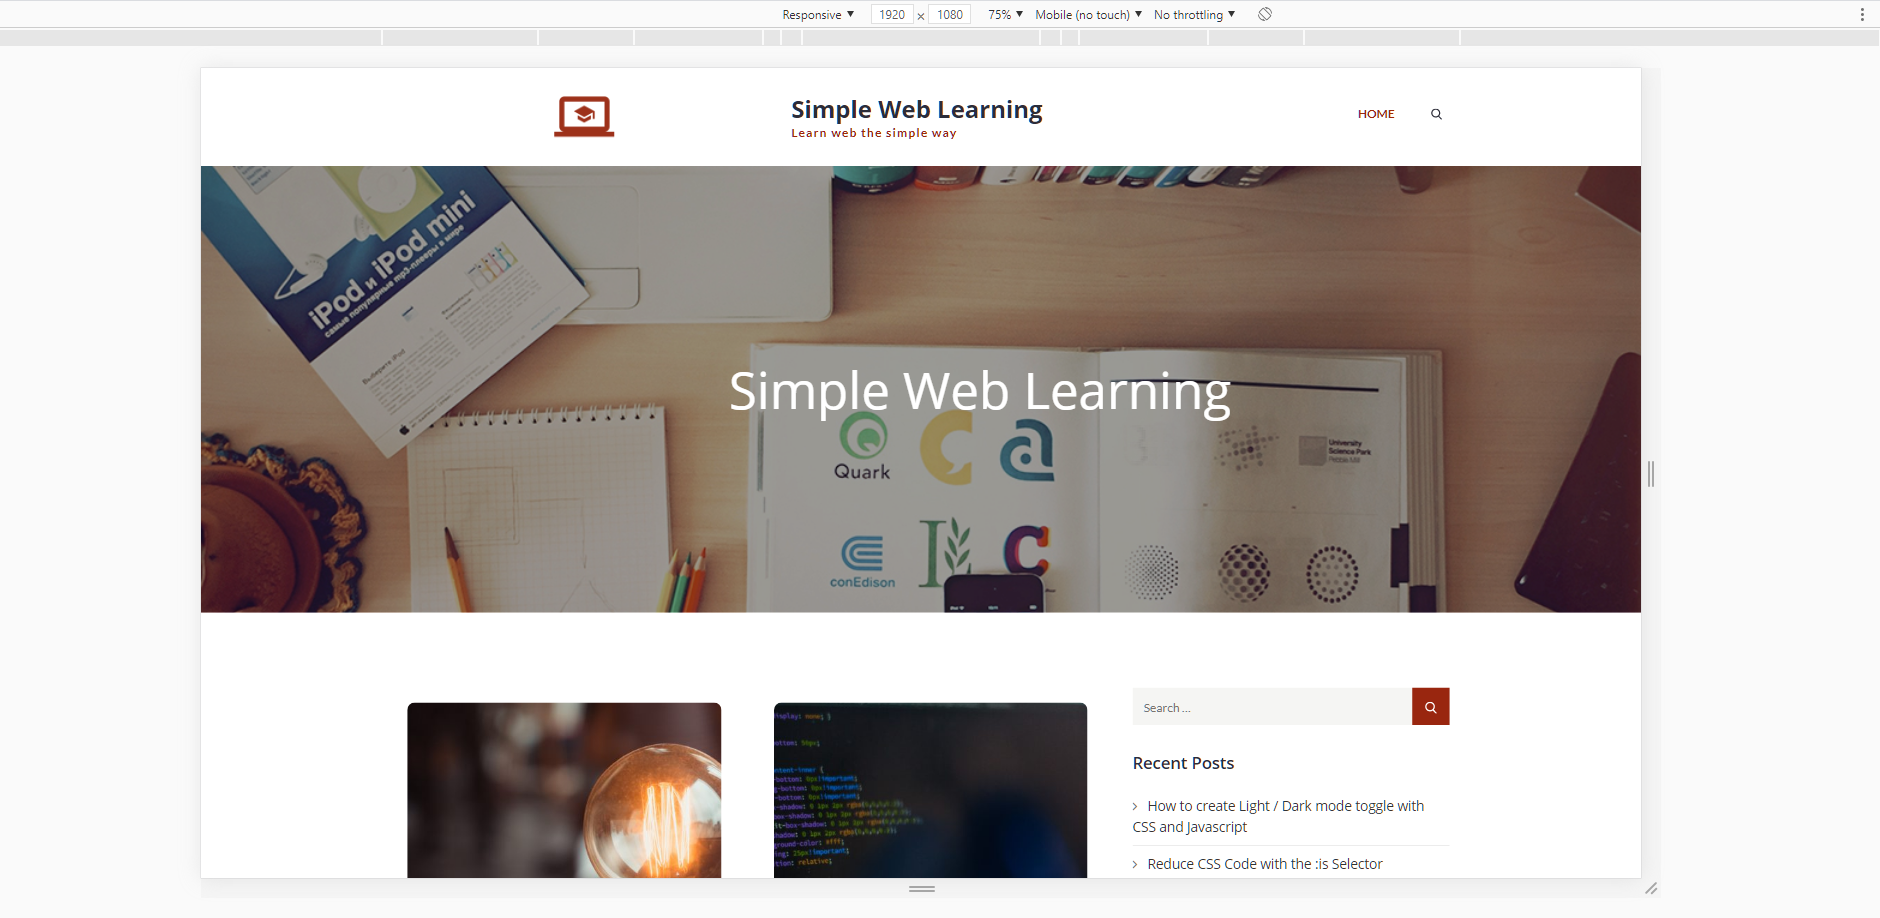
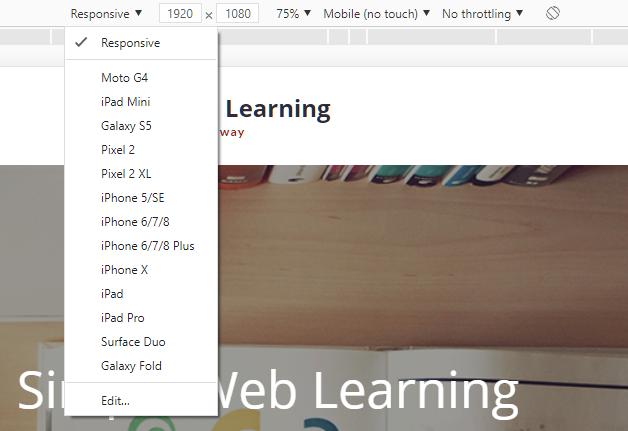
On the top of the website, you’ll notice an additional toolbar appears that allows you to adjust the window width and height. There are three approaches to change the window size, you may adjust the width and height by changing the numbers on the first two input boxes, drag and drop the arrow side on the bottom right corner, or select the Responsive dropdown and switch to width and height of a specific device directly.
You may also change the orientation of the device by clicking on the last button on the right.

During responsive development, you may use this tool to simulate how your website will look like on devices of various sizes.
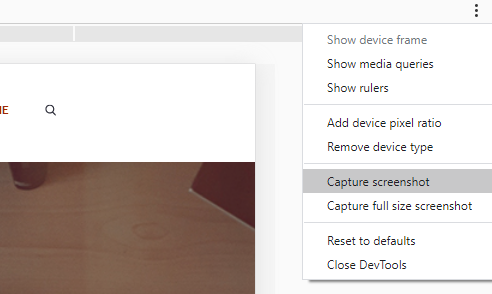
From the three dots menu on the right, you can capture current screen shot or take a full size screen shot.
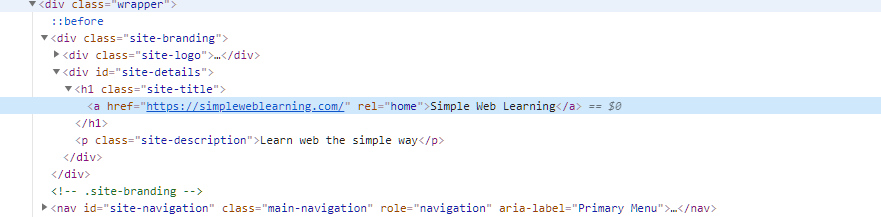
Elements
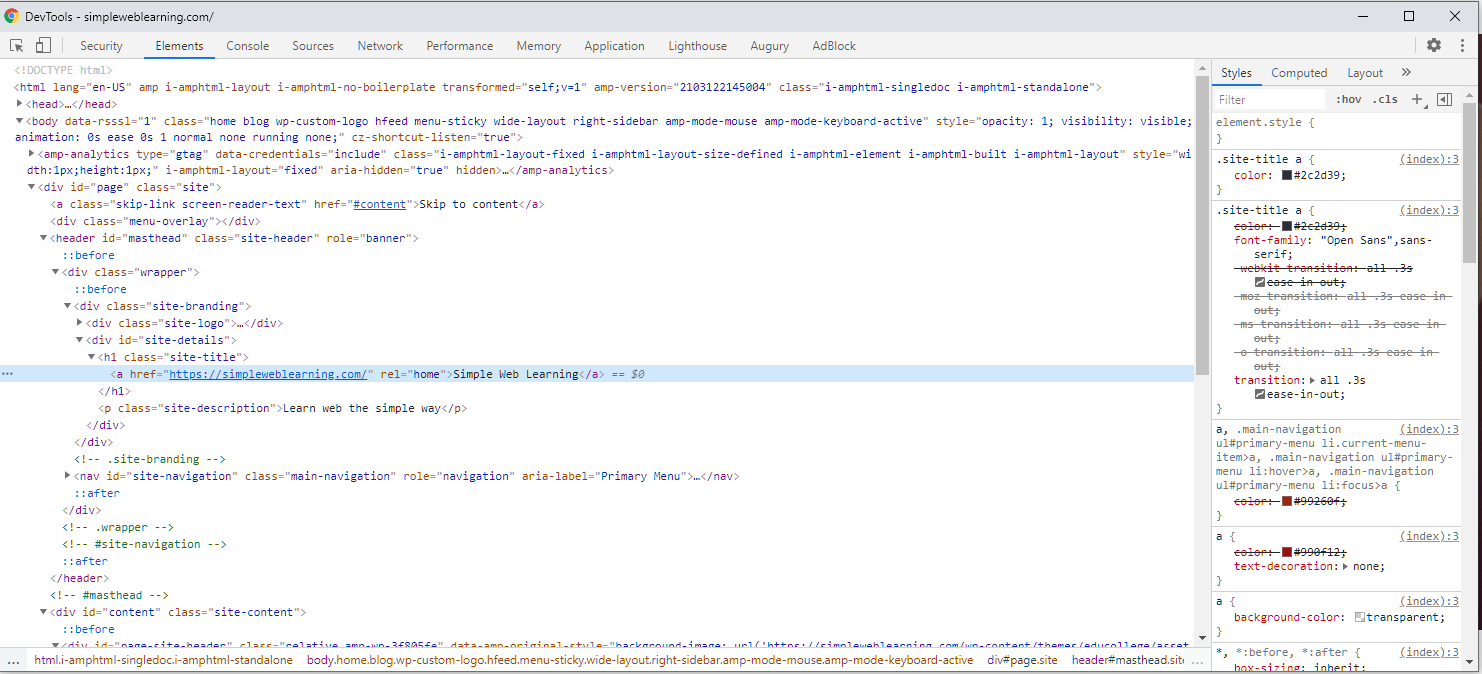
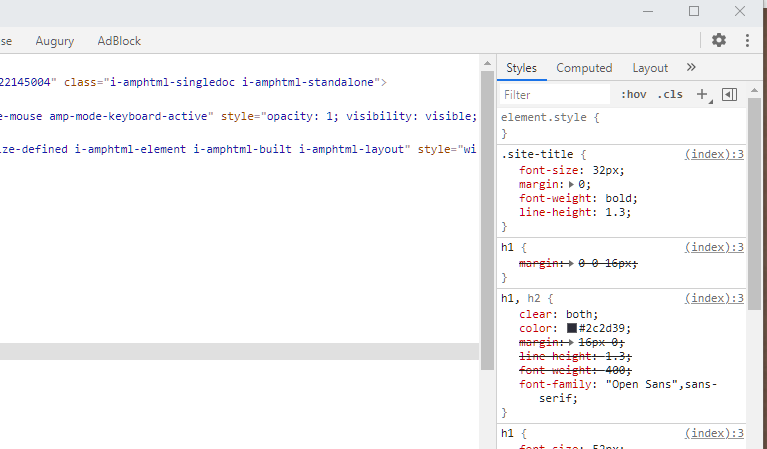
On the Elements tab, you can view the HTML source code at realtime. If the website shows/hides some elements at some point, you will also see the immediate changes from the Elements tab. When you hover an DOM element from the Elements tab, the corresponding element on the page will also be highlighted.
On the right of the panel, you can also see the CSS properties that are applied to the DOM element you currently selected. This is a great way to learn HTML and CSS too when you find something amazing and wonder how it’s implemented. Directly on the HTML and the CSS section, you may modify all properties you see. This comes in handy if you want to test a snippet of your CSS or HTML code right away in the browser. Of course your modification will be lost when you refresh or leave the page, so be sure to copy it to your scripts when you’re done.
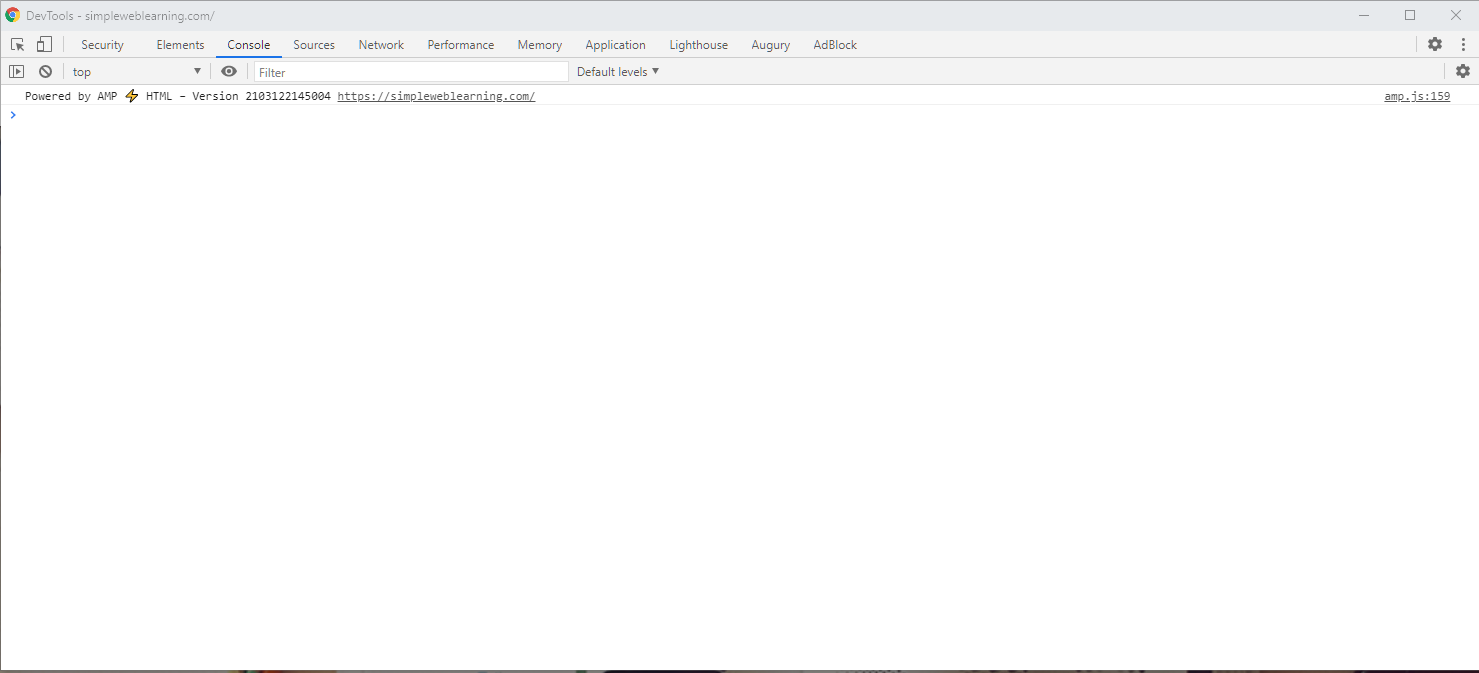
Console
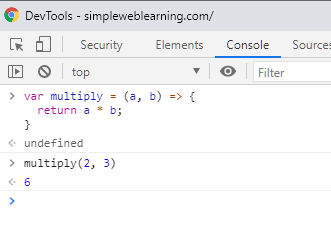
This is where you may find errors or log messages of the website.
While people mainly use it to find errors and log messages, it is also a great playground for you to try out Javascript code. You may declare variables or even functions directly on the console and without any help from code editors, you may run your code snippet directly.
Source
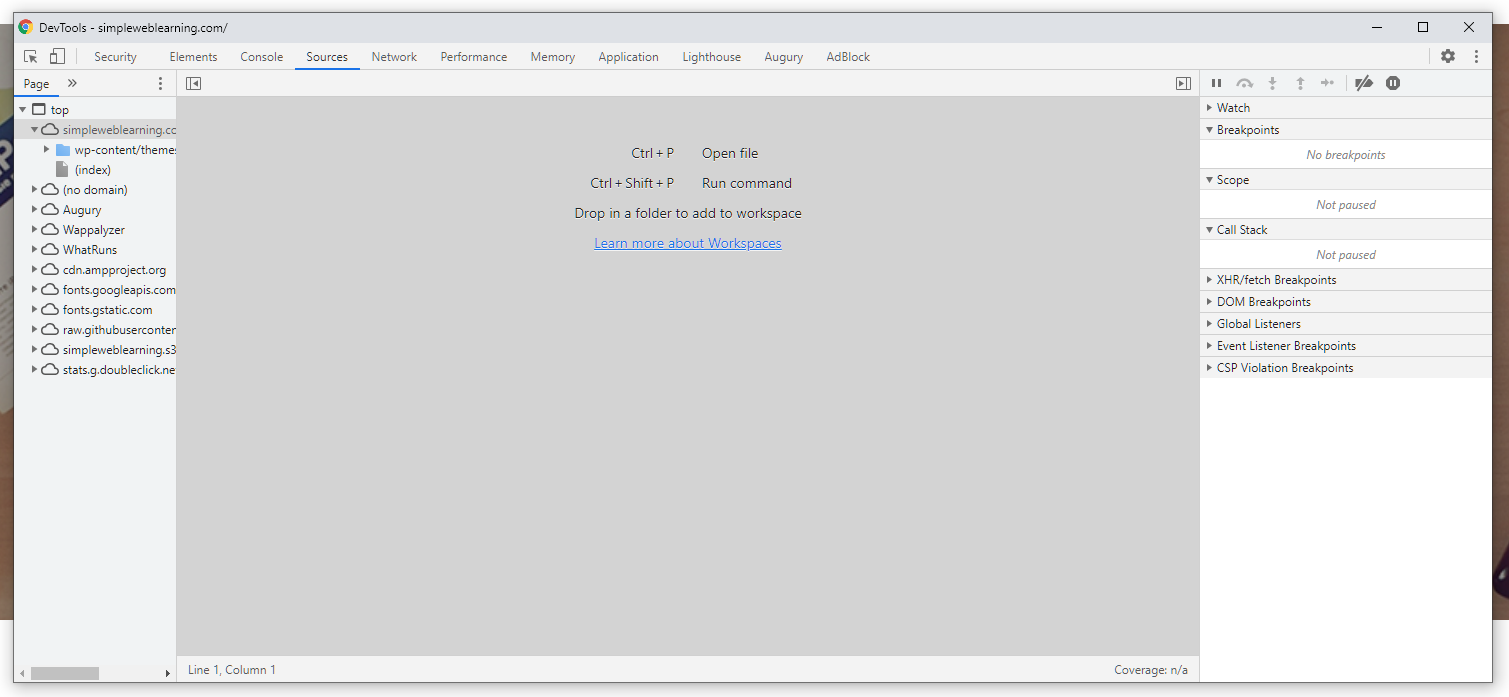
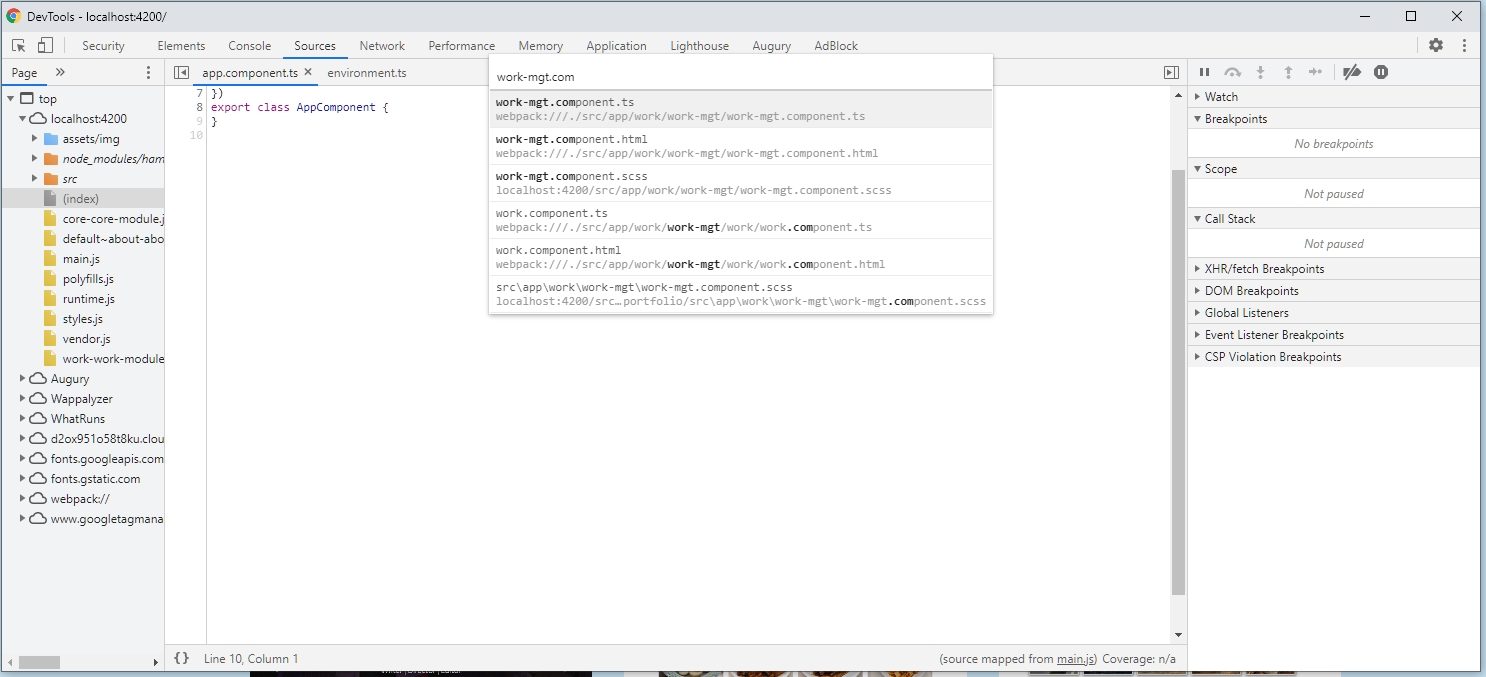
The Source tab allows you to view the source code of the entire website. This feature is especially helpful during development. When you are visiting your own website that’s running on the localhost, you may press Ctrl + P to open a prompt and search for the name of the program you would like to inspect on.
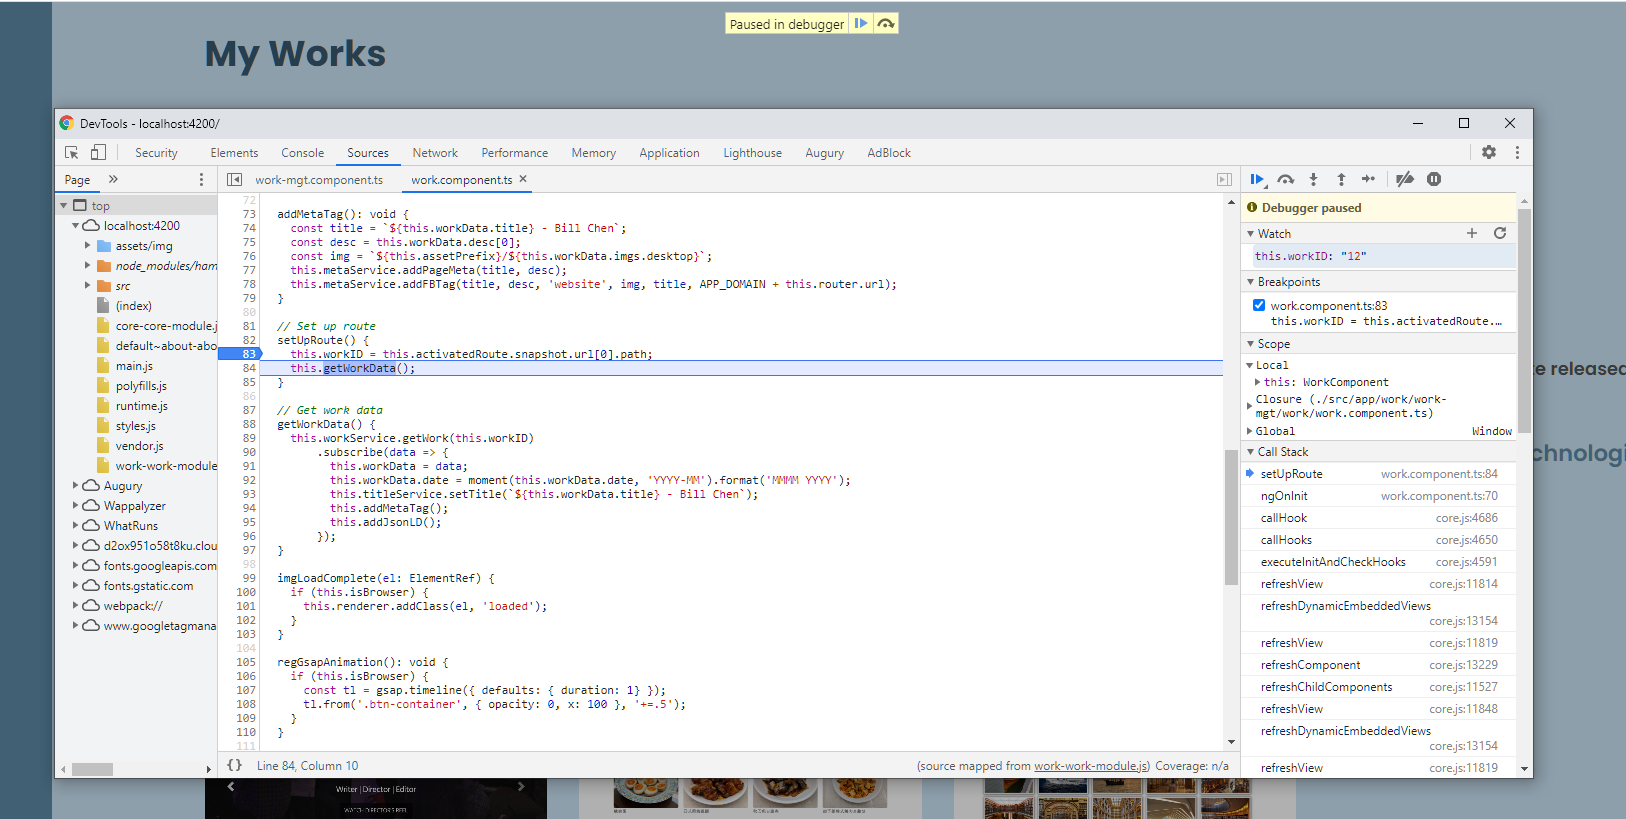
Once you are in the program file, you may click on the line number to set a breakpoint. When the program reaches your breakpoint, it will pause, allowing you to view states of variables or step through line by line to trace the issue.
Network
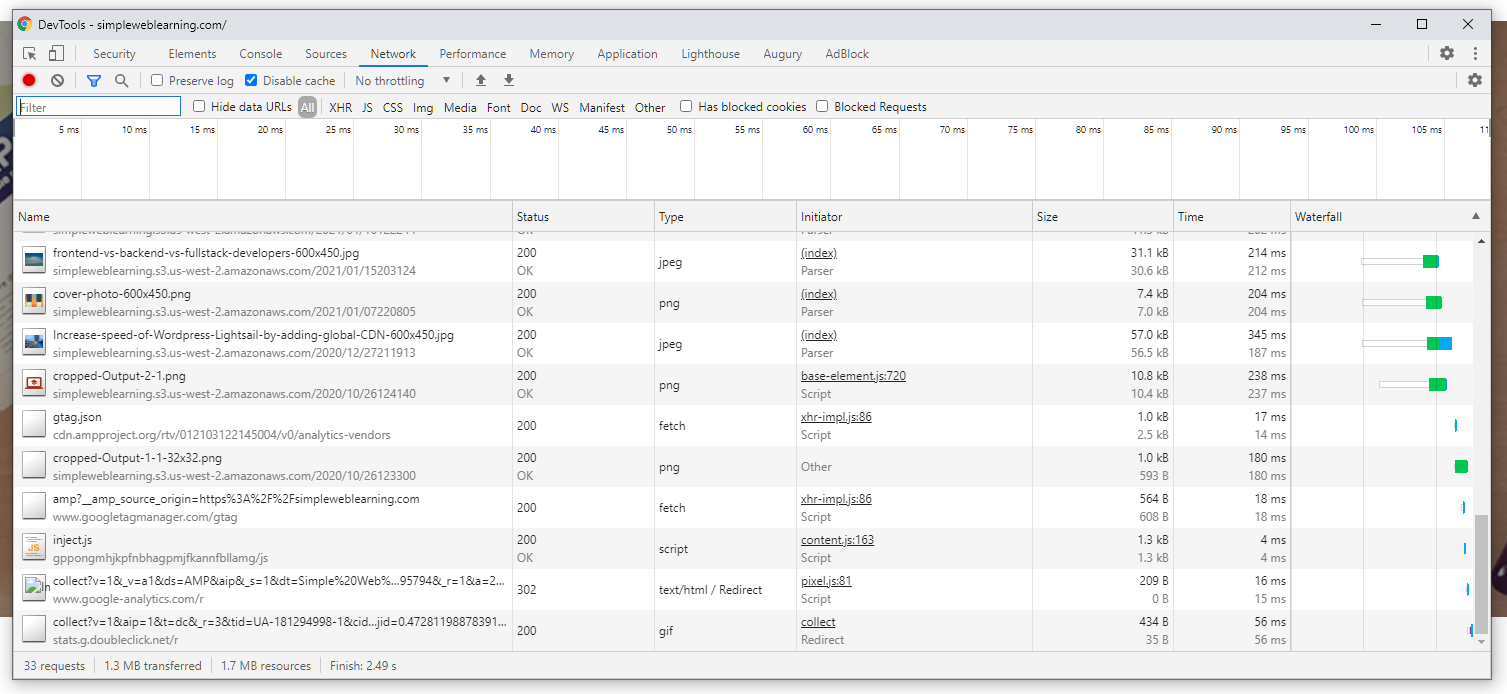
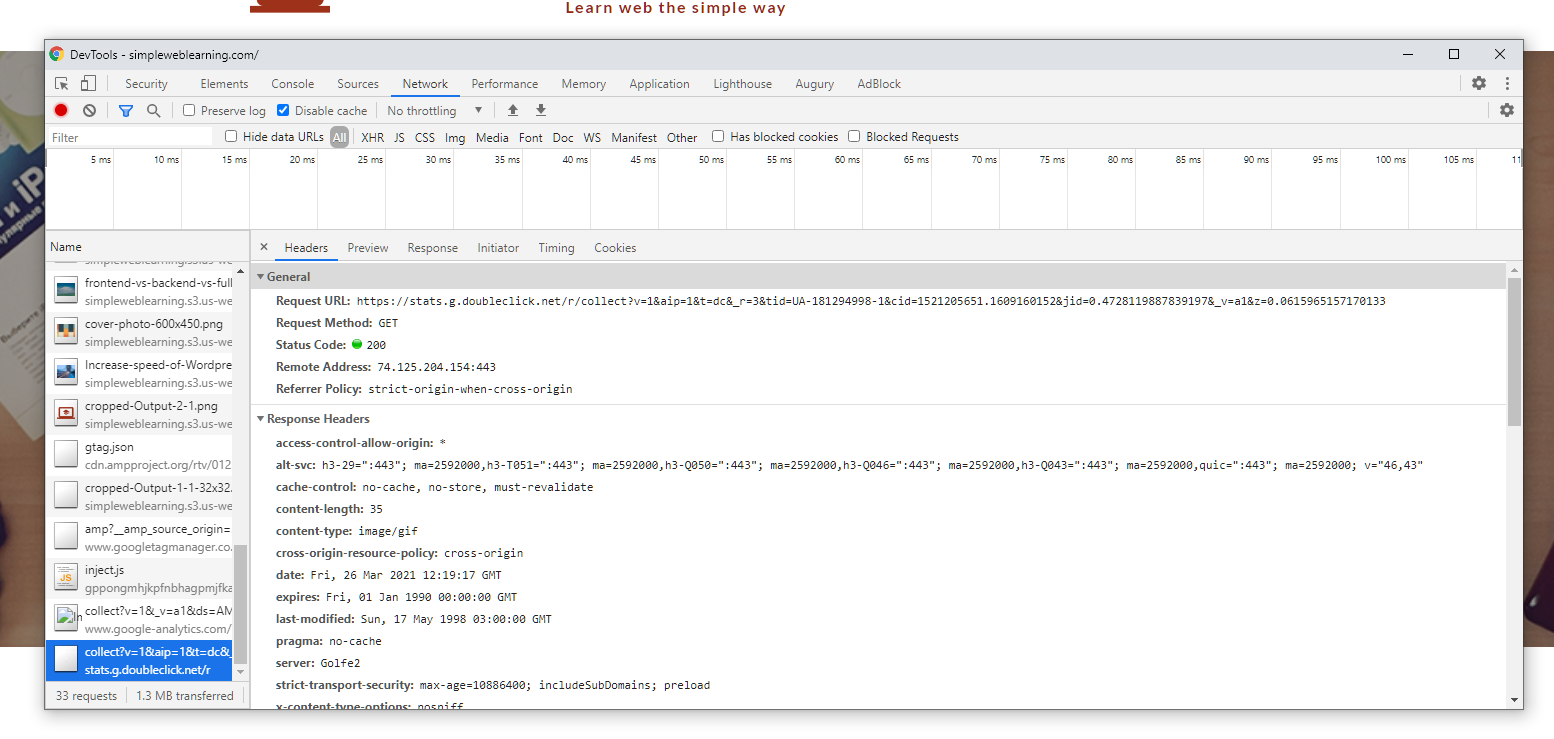
On the Network tab, all resources that are fetched or APIs that are called while rendering the page will be listed here. It will list out the name of the resource (or API url), Http status, response type, Size of the request, and the time it takes to load. If you click on a specific request, you may further find additional details of the request such as header or body.
On the top header, you can set network bandwidth restrictions to simulate offline or slow networks.
Application
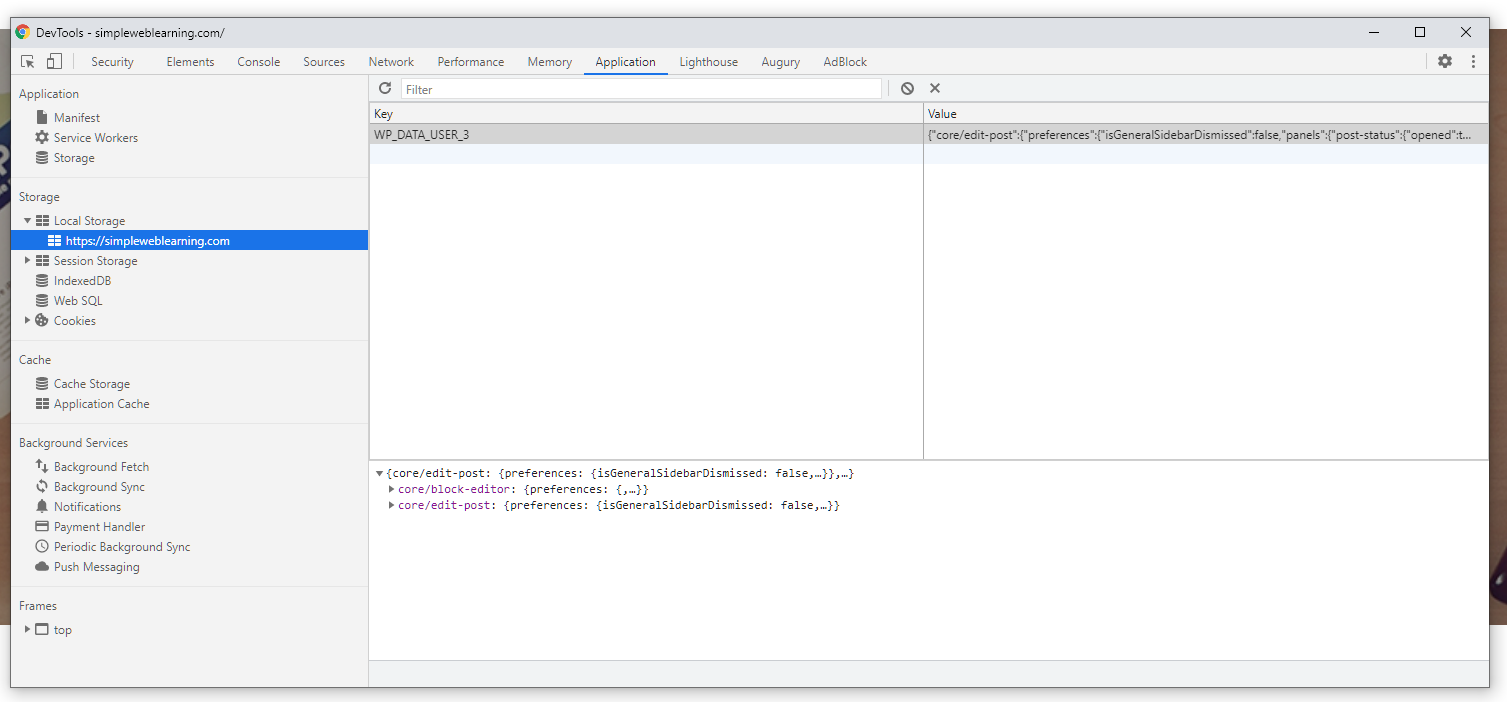
This is where you can find all information that is stored at the browser, such as localStorage, sessionStorage, Cookie, etc.. If the website supports PWA and offline mode, you may also find service worker information here.
Lighthouse
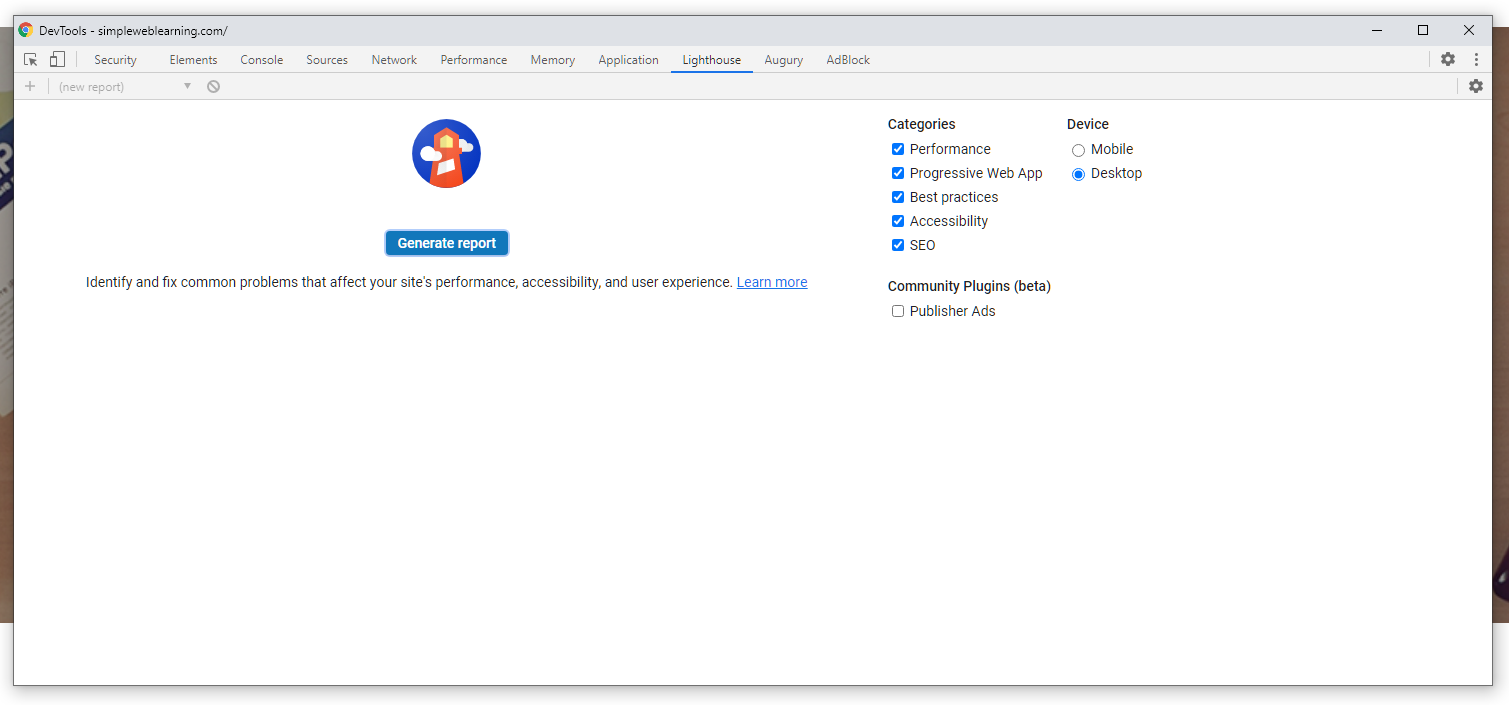
On the Lighthouse tab, you can ask Chrome to run a full diagnosis on your website. Lighthouse will analyze your website in five may aspects including Performance, Accessibility, Best Practices, SEO, and Progressive Web App.
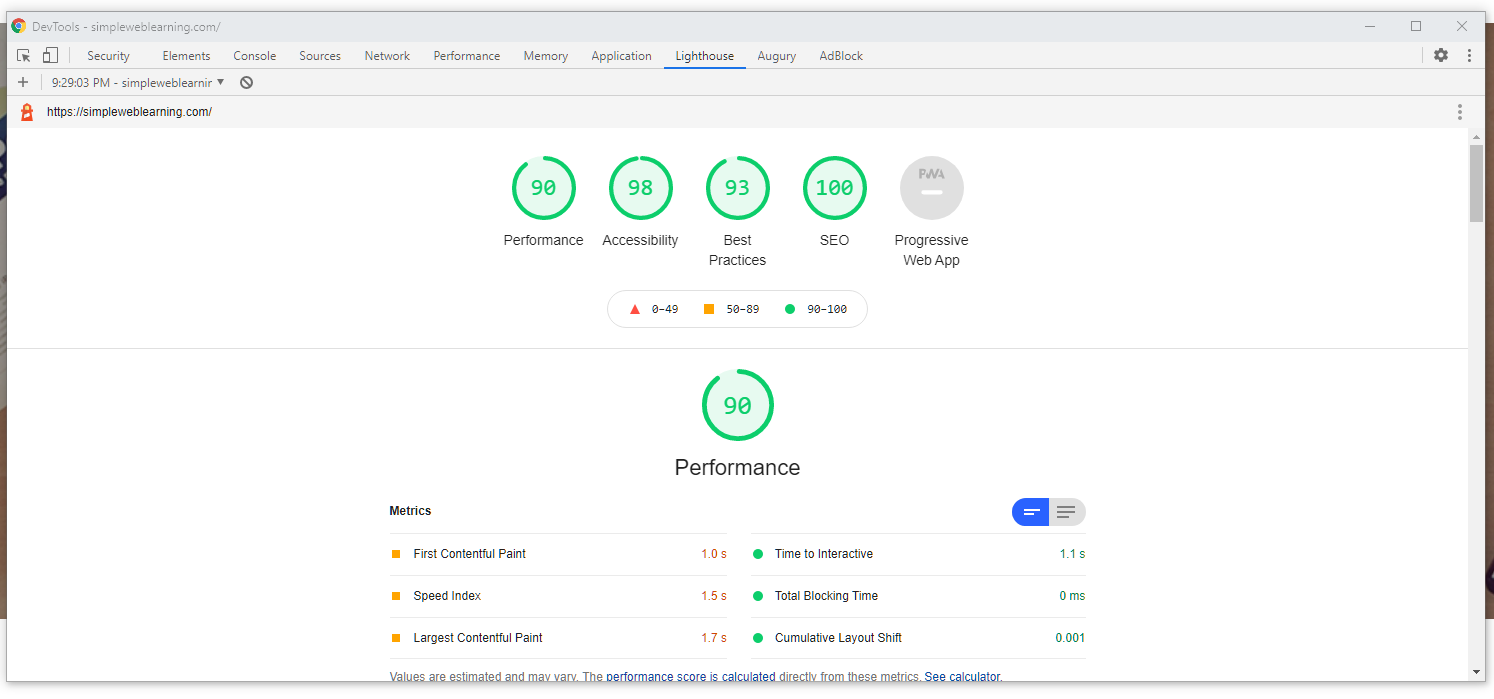
Under each section, you may find detail of all tests Chrome performs on your website with detailed explanations of what each test is about and how you may improve your website. Following the suggestions from the Lighthouse can help you reach a higher score on SEO ranking.
Conclusion
We have covered many features of Chrome Developer Tool in this article. Most of them can provide great value to your daily basis Frontend tasks. If you’d like to learn more detail about the Chrome Developer Tool, please visit the official document page from Google at https://developer.chrome.com/docs/devtools/overview/